lifetestプロシジャでもカプランマイヤープロットは作成できますが、もう少しカスタマイズしたいときはデータセットを出力して作図プロシジャでグラフを出力したほうが良いです。
sgplotでも実現できますが、ここではGTLを利用したカスタマイズ法をご紹介します。
打ち切りと生存曲線をプロットする
実はlifetestプロシジャでは作図用のデータセットを内部で生成しています。outsurvオプションで生存率を出力するのも手ですが、内部で生成されたデータセットを利用したほうが前処理の手間がなくらくちんです。
また格納される変数は常に同じ変数名なので、dynamic variableを利用する必要もありません。このデータセットはodsを利用して「survivalplot」という名のデータセットを参照すれば任意の名前のデータセットとして出力できます。
ods output survivalplot=plotdata;
proc LIFETEST data=Bmt2 ;
time T*Status(0);
strata Group ;
run;
カプランマイヤープロットのような階段状の曲線を作図するにはstepplotステートメントを使用します。引数とオプションはseriesプロットとほぼ同じです。
stepplot x=x変数 y=y変数 / < options >;打ち切りは散布図のマーカーで表現します。lifetestプロシジャではマーカーはプラス記号を使っていますが、markerattrsオプションで任意のマーカーに変更できます。
proc template;
define statgraph survival;
begingraph;
   layout overlay /
      xaxisopts=(label="Time"
         linearopts=(viewmin=0 viewmax=2750
            tickvaluesequence=(start=0 end=2750 increment=250)
         )
      )
      yaxisopts=(label="survival probability"
         linearopts=(viewmin=0 viewmax=1
            tickvaluesequence=(start=0 end=1 increment=0.25)
         )
      );

      stepplot x=time y=survival /
         group=stratum;
      scatterplot x=time y=censored /
         group=stratum
         markerattrs=(symbol=plus);
   endlayout;
endgraph;
end;
run;

proc sgrender data=plotdata template=survival;
run;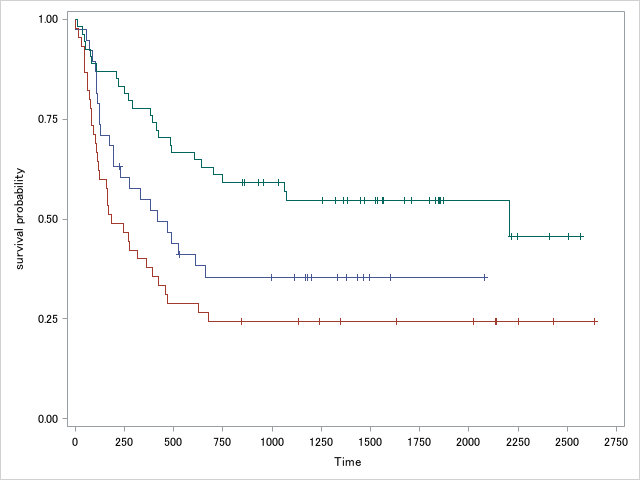
信頼区間をプロットする
信頼区間はoutservオプションで指定したデータセットに格納されており、通常は上記のsurvivalplotデータセットとマージして値を加工すれば作図データセットを作成できます。
しかしplotsオプションでsurvival(cl)を指定することでsurvivalplotデータセットに最初から前処理がされた状態で出力されます。
前処理の工程が少なく済むのでこちらのほうが楽です。
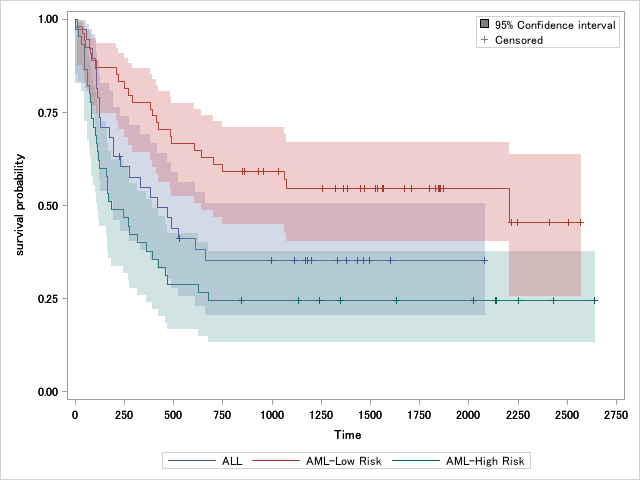
信頼区間の作図にはbandplotステートメントを使用します。bandplotによる信頼区間の表示は以前の記事にて紹介しています。

stepplotの信頼区間の場合はtype=stepを指定するのがポイント。信頼区間に塗りを適用する場合はdatatransparencyオプションで透過度を上げておくと見やすいです。塗りは非表示にする場合はdisplay=(outline)を追加します。
また複数の系列を表示する場合はattribute mapを使用することをお勧めします。
proc template;
define statgraph survival;
begingraph;
discreteattrmap name="group" / discretelegendentrypolicy=attrmap;
   value "ALL" / lineattrs=GraphData1
                 markerattrs=GraphData1(symbol=plus)
                 fillattrs=GraphData1;
   value "AML-Low Risk" / lineattrs=GraphData2
                          markerattrs=GraphData2(symbol=plus)
                          fillattrs=GraphData2;
   value "AML-High Risk" / lineattrs=GraphData3
                           markerattrs=GraphData3(symbol=plus)
                           fillattrs=GraphData3;
enddiscreteattrmap;
discreteattrvar var=stratum attrmap="group" attrvar=_grp;

legenditem type=fill name="CI" /
   fillattrs=(color=grey)
   label="95% Confidence interval" ;

legenditem type=marker name="censor" /
   markerattrs=(symbol=plus color=grey)
   label="Censored";

   layout overlay /
      xaxisopts=(label="Time"
         linearopts=(viewmin=0 viewmax=2750
            tickvaluesequence=(start=0 end=2750 increment=250)
         )
       )
      yaxisopts=(label="survival probability"
         linearopts=(viewmin=0 viewmax=1
            tickvaluesequence=(start=0 end=1 increment=0.25)
         )
      );

      stepplot x=time y=survival /
         name="surv"
         group=_grp;

      bandplot x=time limitlower=SDF_LCL limitupper=SDF_UCL /
         group=_grp
         type=step
         datatransparency=0.7;

      scatterplot x=time y=censored /
         group=_grp ;

      discretelegend "CI" "censor" /
         location=inside
         autoalign=(topright bottomright bottomleft)
         across=1 ;

      discretelegend "surv" /
         location=outside ;

endlayout;
endgraph;
end;
run;

proc sgrender data=plotdata template=survival;
run;