
これはあまり作図することはないのですが、箱ひげ図と平均値の推移を折れ線グラフとして作図する依頼があったりするのでメモ。
X軸を離散変数(値の大小は存在しない軸)か線形軸(値の大小があり、値が連続的)の二種類で作図するケースがあるかと思いますが、今回は両方とも対応できる方法を紹介します。
さらにattribute mapを駆使してグループごとに折れ線の線種を切り替えます。
作図方法
boxplotステートメントではconnectlineをサポートしているので平均値の折れ線グラフをboxplot単体で作図することも可能なのですが、線種を切り替えることができないため、
今回はboxplotとseriesplotを併用することにします。boxplotおよびseriesplotそれぞれにattribute mapを定義し、各グループの表示位置をclusterwidthオプションで厳密に定義します。
clusterwidthはグループデータを表示するときに各データの間隔を設定するオプションですが、省略するとboxplotとseriesplotのデータ間隔がずれる可能性があるので、両者とも同じ値を設定します。
boxplotの解説は以下の記事を参照してください。

離散変数軸の場合
proc template;
define statgraph box_series;
begingraph;

*箱ひげ図のattribute map;
discreteattrmap name="grp";
   value "Placebo"/ lineattrs=Graphdata1 fillattrs=GraphData1(transparency=0.4);
   value "10mg" / lineattrs=Graphdata2 fillattrs=GraphData2(transparency=0.4);
   value "50mg" / lineattrs=Graphdata3 fillattrs=GraphData3(transparency=0.4);
enddiscreteattrmap;

*折れ線のattribute map;
discreteattrmap name="grp2";
   value "Placebo"/ lineattrs=Graphdata1(thickness=2 pattern=solid) markerattrs=GraphData1(symbol=circlefilled) ;
   value "10mg" / lineattrs=Graphdata2(thickness=2 pattern=DashDotDot) markerattrs=GraphData2(symbol=circlefilled) ;
   value "50mg" /lineattrs=Graphdata3(thickness=2 pattern=mediumdash) markerattrs=GraphData3(symbol=circlefilled);
enddiscreteattrmap;

discreteattrvar attrmap="grp" var=group attrvar=_grp;
discreteattrvar attrmap="grp2" var=group attrvar=_grp2;

layout overlay /
   xaxisopts=( label="評価時点(h)" type=discrete)
   yaxisopts=(label="薬物濃度(ng/mL)");

   boxplot y=aval x=avisit/
      group=_grp
      groupdisplay=cluster
      clusterwidth=0.7
      grouporder=ascending
      spread=true
      display=(CAPS FILL MEDIAN OUTLIERS)
      name="box" ;

    seriesplot x=aval2 y=mean /
      display=(markers)
      group=_grp2
      groupdisplay=cluster
      clusterwidth=0.7
      grouporder=ascending;

   discretelegend "box" /
      location=inside
      autoalign=(topright bottomright);
endlayout;
endgraph;
end;
run;

proc sgrender data=plotdata template=box_series;
run;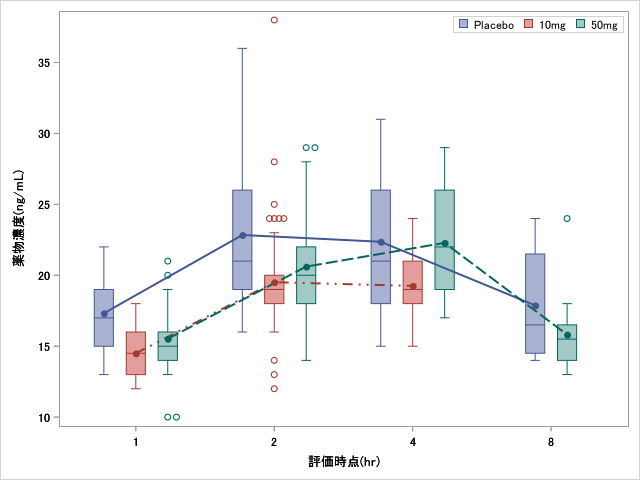
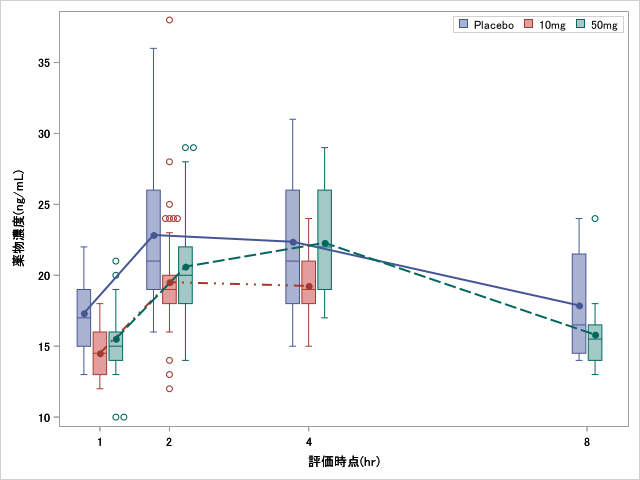
線形軸の場合
xaxisoptsの「type=discrete」を以下のように書き換えます。またclusterwidthを適宜修正します。tickvaluelistオプションは目盛の値をリストで指定します。
type=linear linearopts=(tickvaluelist=(1 2 4 8))
塗りパターンが使えない
この方法の欠点は箱ひげ図に塗りパターン(箱内部を斜線の模様にするなど)ができないことです。これはattribute map自体が塗りパターン(fill pattern)に対応していないことに起因します。
しかし現在の作図はカラーで実施することが多いと思います。白黒での出力でないと困るということでなければ素直に色で塗り分ければよさそうです。