前回に引き続き複数のグラフを格子状に配置する方法を検証をしていきます
最後に検証するのはGTLです。
前回記事


eval関数でサブグループ毎にグラフを作成する
GTLではwhereステートメントが使えませんが、eval関数を使用すればwhereステートメントと同等の結果を出力できます。
例えばparamn=1のデータを折れ線グラフで図示するには以下のように書きます。
seriesplot x=eval(ifn(paramn=1, ATPT, .)), y=CHG / < options >;
eval関数は任意のSAS関数を実行することができます。ifn関数でparamn=1以外のX変数の値を欠損値に置き換えています。
欠損値になったデータは作図されませんので、paramn=1のデータのみ作図することができます。
サブグループ毎にグラフを作成してグリッド上に配置するにはdatalatticeレイアウトやdatapanelレイアウトを使うと思われるかもしれませんが、
これらは制約が多すぎて正直あまり使えない印象です。コード量が多くなってしまいますが、llatticeレイアウトを使用してグリッドごとに作図を定義したほうが汎用性は高いと思います。
データセットは普通縦積みの形式で作成されますから、eval関数を使用すればデータ構造を変えることなく作図することが可能です。
ここではparamn=1~4のサブグループ毎に評価項目の変化量とリスク集合テーブルを作成し、2*2のグリッド上に配置します。
*軸ラベル用フォーマット;

proc format; picture tick
                     0="9"
                     12="99"
                     24="99"
                     36="99"
                     52="99"
                     64="99"
                     76="99"
                     other=" ";
run;

ods escapechar="^";
proc template;
define statgraph figure1a_gtl;
begingraph;

*attribute map設定;
discreteattrmap name="map";
   value "Drug XXX" / lineattrs=(color=green pattern=solid)
                      markerattrs=(color=green symbol=trianglefilled);
   value "Placebo" / lineattrs=(color=grey pattern=solid)
                     markerattrs=(color=grey symbol=circlefilled);
enddiscreteattrmap;

discreteattrvar var=TRT1A attrmap="map" attrvar=_group;
entryfootnote halign=right "upper: response curve, lower: No. of paticipants";

layout lattice / rows=2 columns=3
                 columnweights=(0.04 0.48 0.48)
                 columngutter=5 rowgutter=5;
*1行目ラベル;
   layout overlay;
      entry "Worsening" /
        rotate=90 pad=(bottom=10%);
      drawarrow x1=70 y1=90 x2=70 y2=30 /
        lineattrs=(thickness=1 color=black)
        arrowheadshape=filled
        arrowheadscale=0.5;
   endlayout;
*paramn=1;
   cell;
      cellheader;
         entry "iADRS" / textattrs=(size=10);
      endcellheader;
      layout lattice/ rows=2 rowweights=(0.9 0.1)
                      columndatarange=union;
         layout overlay /
            xaxisopts=(label="Week"
                       linearopts=(viewmax=76 viewmin=0
                       tickvaluesequence=(start=0 end=76 increment=4) tickvalueformat=tick.)
                       )
            yaxisopts=(label="Least squares mean / change from baseline"
                       labelsplitchar="/"
                       labelfitpolicy=splitalways
                       linearopts=( viewmin=-12 viewmax=2
                           tickvaluesequence=(start=-12 end=2 increment=2)
            ));
            seriesplot x=eval(ifn(paramn=1,ATPT,.)) y=CHG /
               group=_group
               display=all
               name="series"
               yerrorlower=lower
               yerrorupper=upper;
            referenceline y=0 /
               lineattrs=(color=black pattern=shortdash thickness=2);

            discretelegend "series" /
                across=1
                location=inside
                autoalign=(bottomleft topright);
        endlayout;

        layout overlay /walldisplay=none
            yaxisopts=(display=none)
            xaxisopts=(display=none
                linearopts=(viewmax=76 viewmin=0
                    tickvaluesequence=(start=0 end=76 increment=4)
                    tickvalueformat=tick.)
            );

           axistable x=eval(ifn(paramn=1,ATPT,.)) value=atrisk /
              class=_group;
        endlayout;
     endlayout;
 endcell;

*paramn=2;
   cell;
      cellheader;
         entry "CDR-SB" / textattrs=(size=10);
      endcellheader;

      layout lattice/ rows=2 rowweights=(0.9 0.1)
                      columndatarange=union;

         layout overlay /
             xaxisopts=(label="Week"
                 linearopts=(viewmax=76 viewmin=0
                    tickvaluesequence=(start=0 end=76 increment=4) tickvalueformat=tick.)
                 )
             yaxisopts=(display=(line ticks tickvalues )
                 linearopts=( viewmin=-2.5 viewmax=0
                     tickvaluesequence=(start=-2.5 end=0 increment=0.5))
             );

             seriesplot x=eval(ifn(paramn=2,ATPT,.)) y=CHG /
                 group=_group
                 display=all
                 name="series"
                 yerrorlower=lower
                 yerrorupper=upper;

             referenceline y=0 /
                 lineattrs=(color=black pattern=shortdash thickness=2);

             discretelegend "series" /
                across=1
                location=inside
                autoalign=(bottomleft topright);
          endlayout;

          layout overlay /walldisplay=none
             yaxisopts=(display=none)
             xaxisopts=(display=none linearopts=(viewmax=76 viewmin=0
                tickvaluesequence=(start=0 end=76 increment=4) tickvalueformat=tick.));

                axistable x=eval(ifn(paramn=2,ATPT,.)) value=atrisk /
                   class=_group;
          endlayout;
       endlayout;
    endcell;

*2行目タイトル;
   layout overlay;
       entry "Worsening" / rotate=90 pad=(bottom=10%);
       drawarrow x1=70 y1=90 x2=70 y2=30 /
          lineattrs=(thickness=1 color=black)
          arrowheadshape=filled
          arrowheadscale=0.5;
    endlayout;
*paramn=3;
   cell;
      cellheader;
         entry "ADAS-Cog" {sub "13"} / textattrs=(size=10);
      endcellheader;
      layout lattice/ rows=2 rowweights=(0.9 0.1)
                      columndatarange=union;
         layout overlay /xaxisopts=(label="Week"
                            linearopts=(viewmax=76 viewmin=0
                            tickvaluesequence=(start=0 end=76 increment=4) tickvalueformat=tick.)
                        )
                        yaxisopts=(label="Least squares mean / change from baseline"
                            labelsplitchar="/"
                            labelfitpolicy=splitalways
                            linearopts=( viewmin=-6 viewmax=1
                            tickvaluesequence=(start=-6 end=1 increment=1))
                        );
              seriesplot x=eval(ifn(paramn=3,ATPT,.)) y=CHG /
                  group=_group
                  display=all
                  name="series"
                  yerrorlower=lower
                  yerrorupper=upper;

              referenceline y=0 / lineattrs=(color=black pattern=shortdash thickness=2);

              discretelegend "series" / across=1 location=inside autoalign=(bottomleft topright);
          endlayout;
          layout overlay /walldisplay=none
             yaxisopts=(display=none)
             xaxisopts=(display=none
                linearopts=(viewmax=76 viewmin=0
                   tickvaluesequence=(start=0 end=76 increment=4) tickvalueformat=tick.));

             axistable x=eval(ifn(paramn=3,ATPT,.)) value=atrisk /
                class=_group;
           endlayout;
       endlayout;
   endcell;

*paramn=4;
   cell;
      cellheader;
         entry "ADCS-iADL" / textattrs=(size=10);
      endcellheader;
      layout lattice/ rows=2 rowweights=(0.9 0.1)
         columndatarange=union;

      layout overlay /
         xaxisopts=(label="Week" linearopts=(viewmax=76 viewmin=0
            tickvaluesequence=(start=0 end=76 increment=4)
            tickvalueformat=tick.) )
         yaxisopts=(display=(line ticks tickvalues )
            linearopts=( viewmin=-6 viewmax=0
            tickvaluesequence=(start=-6 end=0 increment=2)
         ));

         seriesplot x=eval(ifn(paramn=4,ATPT,.)) y=CHG /
            group=_group
            display=all
            name="series"
            yerrorlower=lower
            yerrorupper=upper;
         referenceline y=0 /
            lineattrs=(color=black pattern=shortdash thickness=2);

         discretelegend "series" /
            across=1
            location=inside
            autoalign=(bottomleft topright);
       endlayout;
   layout overlay /walldisplay=none
       yaxisopts=(display=none)
       xaxisopts=(display=none linearopts=(viewmax=76 viewmin=0
          tickvaluesequence=(start=0 end=76 increment=4)
          tickvalueformat=tick.));

       axistable x=eval(ifn(paramn=4,ATPT,.)) value=atrisk /
          class=_group;
       endlayout;
     endlayout;
  endcell;
endlayout;
endgraph;
end;
run;

/*念のため 画像出力 */
ods graphics /imagename="graph_gridded" width=28cm noborder ;
ods listing gpath="画像保存パス" ;
options nobyline nodate orientation=landscape;
ods rtf file="保存パス";
proc sgrender data=import2 template=figure1a_gtl;
run;
ods rtf close;
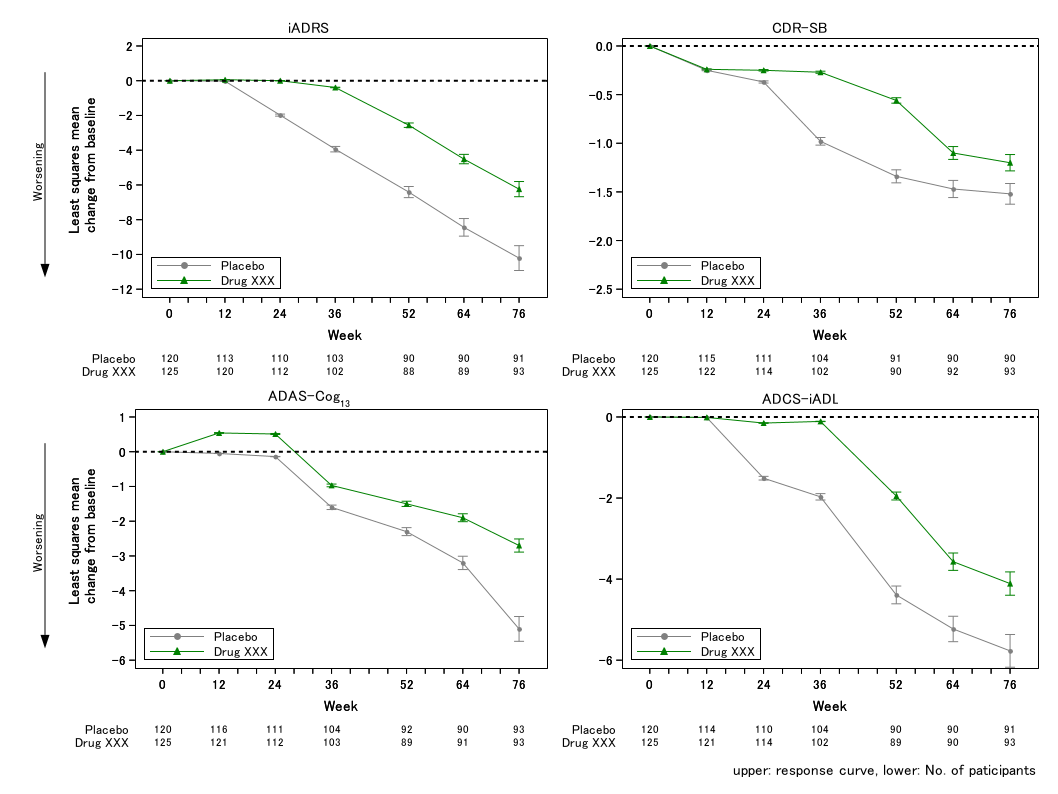

RTFでも正常に出力できました。
コード量が多くわかりにくいのでレイアウトの構造を図示してみました。
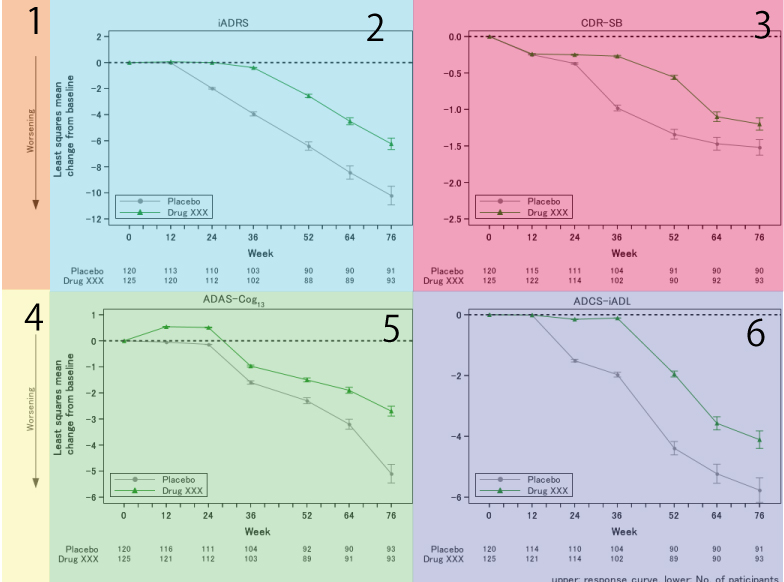
グラフエリアを2*3に分割し、1,4には矢印を、2,3,5,6にはグラフを配置します。2,3,5,6はさらに上下に分割し、上には折れ線グラフ、下はリスク集合テーブルをを配置しています。
このような表だと行と列に共通軸を設定できるのですが、layout latticeがネストしているのと縦軸の設定が各グラフでバラバラなので、軸設定は個別に指定し、表示する要素を細かく指定しています。
評価項目名はcellheaderレイアウトで配置しました。
凡例は共通ですので、globallegendレイアウト上に1つだけ配置しても良かったかもしれませんね。リスク集合テーブルはプロットエリア内に配置したほうがもっとスペースを節約できそうです。
GTLは各グラフの共通要素を配置する専用のレイアウトがあるので、表示スペースを節約できます。
複数のグラフ配置するのはやはり圧倒的にGTLが高機能です。
難易度が高い
RTF出力も問題なくできるし、各要素を細かく設定できるので論文投稿用の凝った成果物を作成したいのであればGTL一択なのですが・・・コード量が多いのでちと大変です。datalatticeが使い勝手悪く、今回のケースでは使えないためどうしても同じようなコードを何度も書くことになってしまいます。メンテナンス性は良いかといわれる微妙なところです。
datalatticeレイアウトの機能を拡張してくれると楽になるのですけど無理かな・・・
結論
3回の検証の結果、以下のような結論となりました。
全く同じ設定のグラフを単純にグリッド上に配置するのみで、PDFやHTML形式の出力で出力する場合
→proc report
各グラフの要素を細かく指定し洗練されたグラフを作成したい場合、あるいはRTFとEMF形式でないと困る場合
→GTL
RTFでの出力が一般的でしょうから、やっぱりGTL使うしかないのではないでしょうか。
