地図でおなじみの等高線ですが、科学分野においても三次元データを平面に図示する際に利用されます。
等高線はGTLでも作図することができます。
Contourplotparm ステートメント
等高線はContourplotparmステートメントで作図することができます。
layout overlay/

   xaxisopts=(offsetmin=0 offsetmax=0 linearopts=(thresholdmin=0 thresholdmax=0))
   yaxisopts=(offsetmin=0 offsetmax=0 linearopts=( thresholdmin=0 thresholdmax=0));

   contourplotparm x=< x variable> y=< y variable > z=< z variable > / < option >;

endlayout;
x,y,z軸の変数をそれぞれ指定するだけで作図できます。
デフォルト設定で作図するとプロットエリア全体を塗りつぶされます。このとき軸と塗りつぶしの間に空白が生じるので、
xaxisoptsとyaxisoptsを上記のように設定することで空白を取り除くことができます。
作図設定
今回は2変数正規乱数を生成し、それをKDEで密度推定した結果を等高線として表現します。
なおSASでは多変数正規乱数を生成する関数がありません。IMLでプログラムすれば可能ですが、めんどくさいのでnumpyのmultivariate_normalで生成した乱数を
SASで読み込んでデータセットを生成しています。
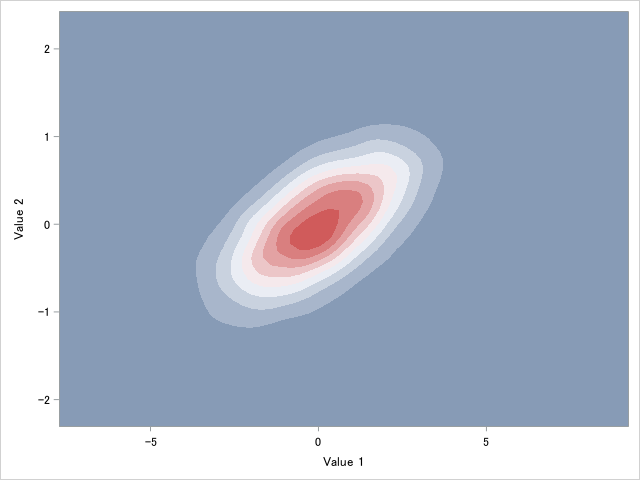
まずはデフォルトで作図するとこうなります。
*密度を推定;
proc kde data=import;
bivar x y / out=test;
run;

proc template;
define statgraph contour;
begingraph;
   layout overlay/
      xaxisopts=(offsetmin=0 offsetmax=0 linearopts=(thresholdmin=0 thresholdmax=0))
      yaxisopts=(offsetmin=0 offsetmax=0 linearopts=( thresholdmin=0 thresholdmax=0));

      contourplotparm x=value1 y=value2 z=density;
endlayout;
endgraph;
end;
run;

proc sgrender data=test template=contour;
run;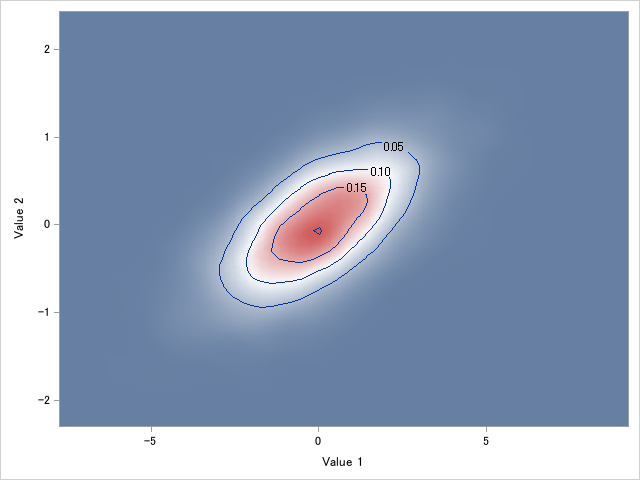
等高線(デフォルト設定)
これをカスタマイズしていきます。
等高線タイプの変更
等高線はcontourtypeオプションで変更できます。主な設定を以下に例示します。
contourplotparm x=value1 y=value2 z=density / contourtype=fill nlevel=10;なおnlevelオプションで等高線の水準数を指摘できます。
contourplotparm x=value1 y=value2 z=density / contourtype=line nlevels=10;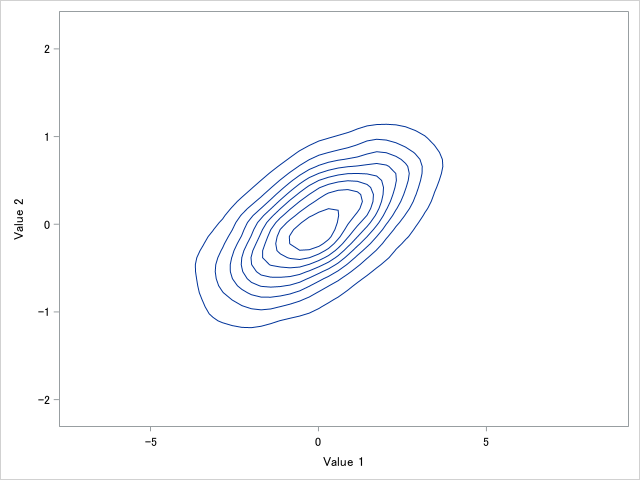
contourplotparm x=value1 y=value2 z=density / contourtype=gradient ;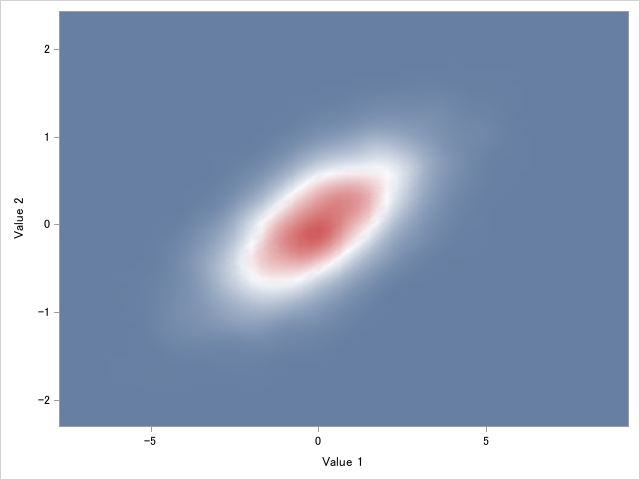
contourplotparm x=value1 y=value2 z=density / contourtype=labeledline nlevels=10 ;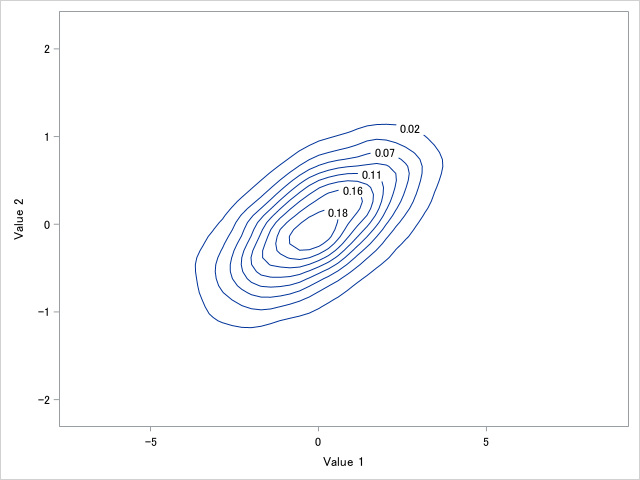
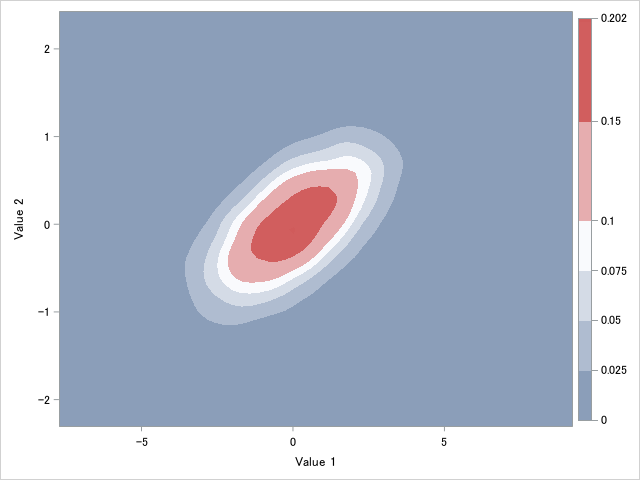
凡例を追加
凡例はcoutinuouslegendステートメントを追加するだけです。その場合はcontourplotparmステートメントにnameオプションを指定する必要があります。
proc template;
define statgraph contour;
begingraph;
layout overlay/
   xaxisopts=(offsetmin=0 offsetmax=0
      linearopts=(thresholdmin=0 thresholdmax=0))
   yaxisopts=(offsetmin=0 offsetmax=0
      linearopts=( thresholdmin=0 thresholdmax=0));

   contourplotparm x=value1 y=value2 z=density /
      contourtype=fill
      name="cont"
      nlevels=10 ;

   continuouslegend "cont";
endlayout;
endgraph;
end;
run;

proc sgrender data=test template=contour;
run;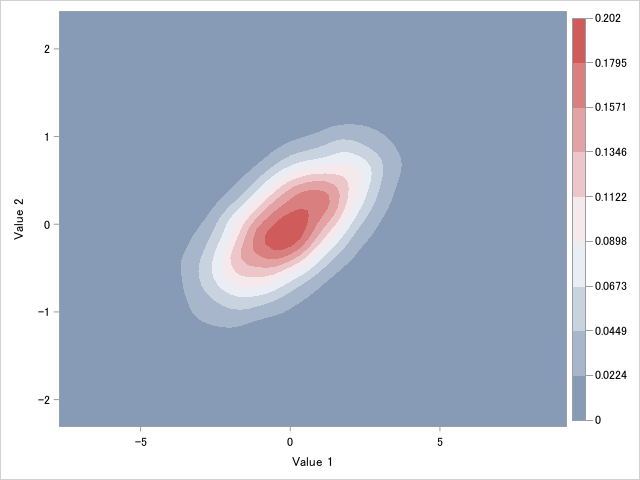
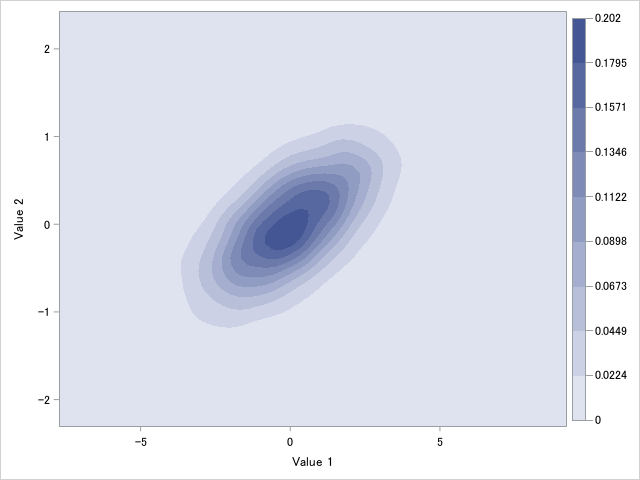
塗りつぶしパターンを変更する
塗りつぶしパターンを変更するにはcolormodelオプションで色を指定します。
組み込みパターン(colorramp)かリスト形式で指定できるようです。なおデフォルト設定はthreecolorrampです。
contourplotparm x=value1 y=value2 z=density / colormodel=twocolorramp contourtype=fill name="cont" nlevels=10 ;
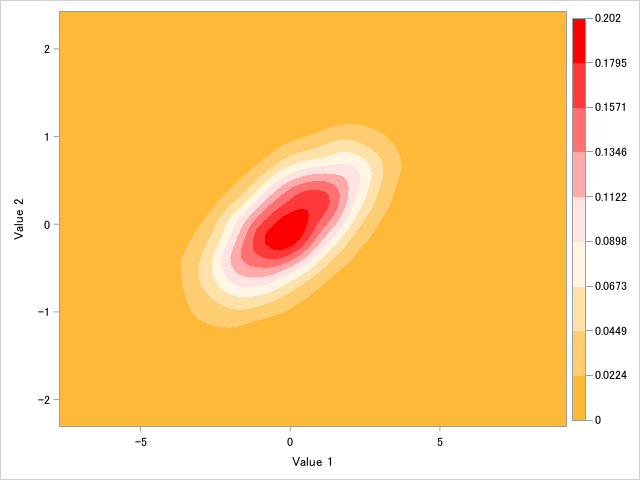
contourplotparm x=value1 y=value2 z=density / colormodel=(orange white red) contourtype=fill name="cont" nlevels=10 ;リスト形式で指定すると、指定した色を使ってグラデーションを表現します。
 \
\RGB,HSV, CMYK形式で色を指定することも可能です。ここではRGBで指定してみました。RGBの場合はカラーコードの前にcxをつける必要があります。
contourplotparm x=value1 y=value2 z=density / colormodel=(cxedcbb4 cxc33e56 cx22172d ) contourtype=fill name="cont" nlevels=10 ;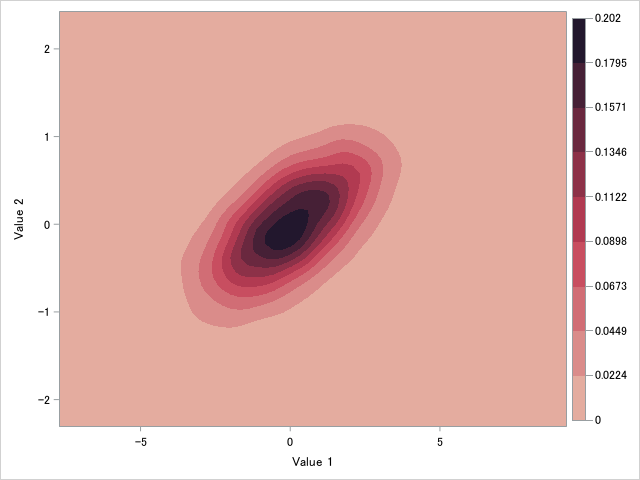
等高線を指定する
特定の水準を等高線として表現するにはlevelsオプションを使用します。リストで等高線して表示させたい水準値を指定します。
contourplotparm x=value1 y=value2 z=density /levels=(0.025 0.05 0.075 0.1 0.15 0.2) contourtype=fill name="cont" ;