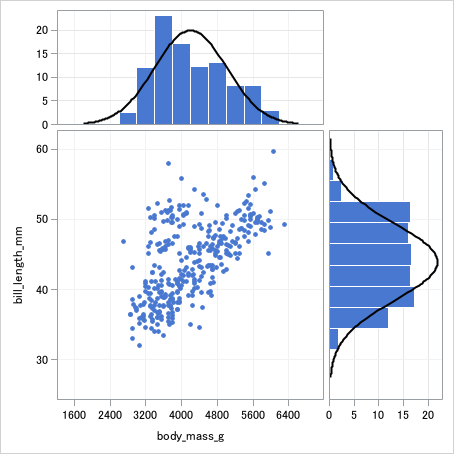
X軸およびY軸の周辺部にヒストグラム(marginal histogram)がある散布図はX変数およびY変数の分布を一度に視覚化できます。
SASで作図するにはプロットエリアを複数配置する必要があるので、GTLの利用は必須となります。
周辺ヒストグラム付き散布図
ペンギンの体重と嘴の長さの分布を周辺ヒストグラム付き散布図で可視化します。
layout latticeを利用してグラフエリアを4分割し、それぞれの区画にグラフを配置します。
rawdatarange=unionおよびcolumndatarange=unionを設定することで、縦軸と横軸の範囲を統一するのがポイントです。
また右下の区画はorient=horizontal とすることで、ヒストグラムを90度回転させます。
layout latticeは以下の記事でも紹介しています。
layoutステートメントを使いこなす(2) Multi-cell layoutsingle cell layoutブロックは1つのグラフエリアを配置するレイアウトであるのに対し、Multicell layoutは複...
proc template;
define statgraph marginal;
begingraph;
   layout lattice / rows=2 columns=2 rowweights=(0.3 0.7)
                    columnweights=(0.7 0.3)
                    columndatarange=union
                    rowdatarange=union
                    rowgutter=5
                    columngutter=5;

      rowaxes;
         rowaxis / offsetmin=0 display=(ticks tickvalues) griddisplay=on ;
         rowaxis / griddisplay=on gridattrs=(color=cxf2f2f2) ;
      endrowaxes;

      columnaxes;
         columnaxis / griddisplay=on gridattrs=(color=cxf2f2f2);
         columnaxis / offsetmin=0 display=(ticks tickvalues) griddisplay=on ;
      endcolumnaxes;

      /*左上*/
      layout overlay /
         xaxisopts=(display=none);
         histogram body_mass_g /
            fillattrs=(color=cx4878d0)
            outlineattrs=(color=white);
      endlayout;

      /*右上*/
      layout overlay;
         discretelegend "dummy";
      endlayout;

      /*左下*/
      layout overlay;
         scatterplot x=body_mass_g y=bill_length_mm /
            name="mass"
            markerattrs=(symbol=circlefilled color=cx4878d0);
      endlayout;

     /*右下*/
      layout overlay /yaxisopts=(display=none);
         histogram bill_length_mm /
            orient=horizontal
            fillattrs=(color=cx4878d0)
            outlineattrs=(color=white);
      endlayout;
   endlayout;
endgraph;
end;
run;

ods graphics / width=12cm height=12cm;
proc sgrender data=import template=marginal;
run;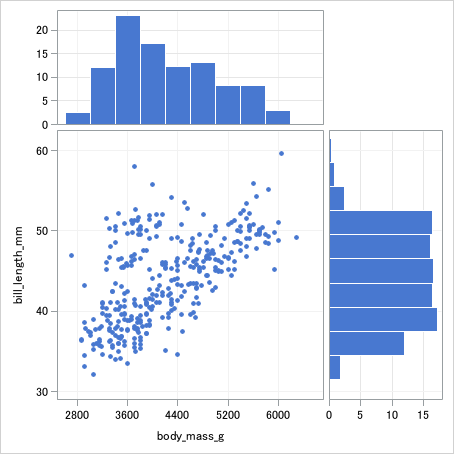
さらにヒストグラムに加えてdensityplotステートメントを追加することで、密度プロットも同時に作図できます。
densityplot bill_length_mm / orient=horizontal lineattrs=(color=black); densityplot body_mass_g / orient=horizontal lineattrs=(color=black);